Frodo TechHave you ever thought that how an investment’s returns can be calculated? What tool is needed?That’s absolutely a big concern of people who invests their money on literally anything! How will my money be returned?2 min read·Jun 11, 2022----
Frodo TechWhat is BSC? How does it work? What are its benefits over the other blockchains?You’ve probably heard of the word Binance Chain, the home of the BNB currency. It’s specified for ultra-fast trading. So, it had to make…3 min read·Jun 8, 2022----
Frodo TechHave you ever heard of the phrase “Sybil Attack”?May the process of making multiple accounts threaten your security? What do you think!?2 min read·Jun 4, 2022----
Frodo TechFrodo Tech Aims to Create Environmentally-Friendly Blockchain Ecosystem That Is Open to EveryoneFrodo Tech aims to create an environmentally-friendly blockchain ecosystem based on a unique cryptocurrency service that all the people in…4 min read·May 31, 2022----
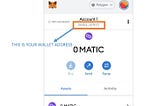
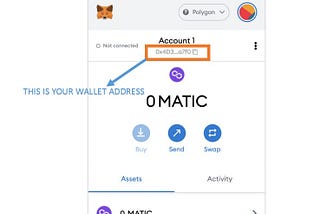
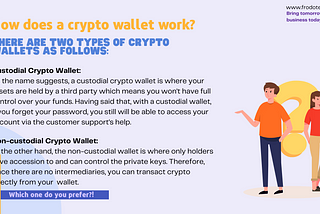
Frodo TechHow does a crypto wallet work?A crypto wallet is a tool that allows you to interact with a blockchain network. Among other things, you can use it to send and receive…2 min read·Apr 10, 2022----
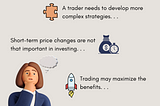
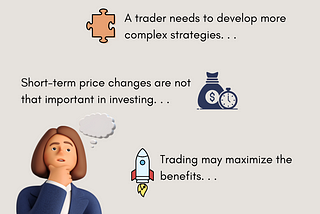
Frodo TechShould I trade or invest?!🔴How long have you been involved with digital currencies? Do you know how to get the best profit out of this brand-new business world? How…2 min read·Apr 3, 2022----
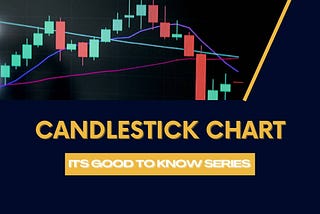
Frodo TechHave you ever heard of a candlestick chart in the crypto world?First of all, what is a candlestick chart⁉️2 min read·Mar 31, 2022----